Collect
Observe marketplace activity continuously across supported markets and platforms.
Southeast Asia ecommerce market intelligence
Magpie gives commercial teams a defensible view of category growth, market share and competitor movement across Southeast Asia's leading ecommerce marketplaces.
Indonesia's tracked online condiments market reached US$5.1 million and grew 35%.
The headline matters. The brand-level movement underneath it is where the commercial decision starts.
Read the dated analysis and methodology →
What Magpie reveals
Start with the commercial question. Magpie connects category, competitor, product, seller and price evidence so your team can decide where a response is actually needed.
See whether your brand is growing with the market, taking share, or losing ground—and which marketplace, seller or SKU caused the movement.
02Identify who is gaining momentum and connect the change to pricing, promotion, assortment, availability and seller activity.
03Find margin pressure, discount patterns, pack-size gaps and portfolio opportunities without relying on sporadic manual checks.
Latest market intelligence
Our research turns continuously tracked marketplace activity into public, dated findings. These are the latest examples of the market questions Magpie can answer.
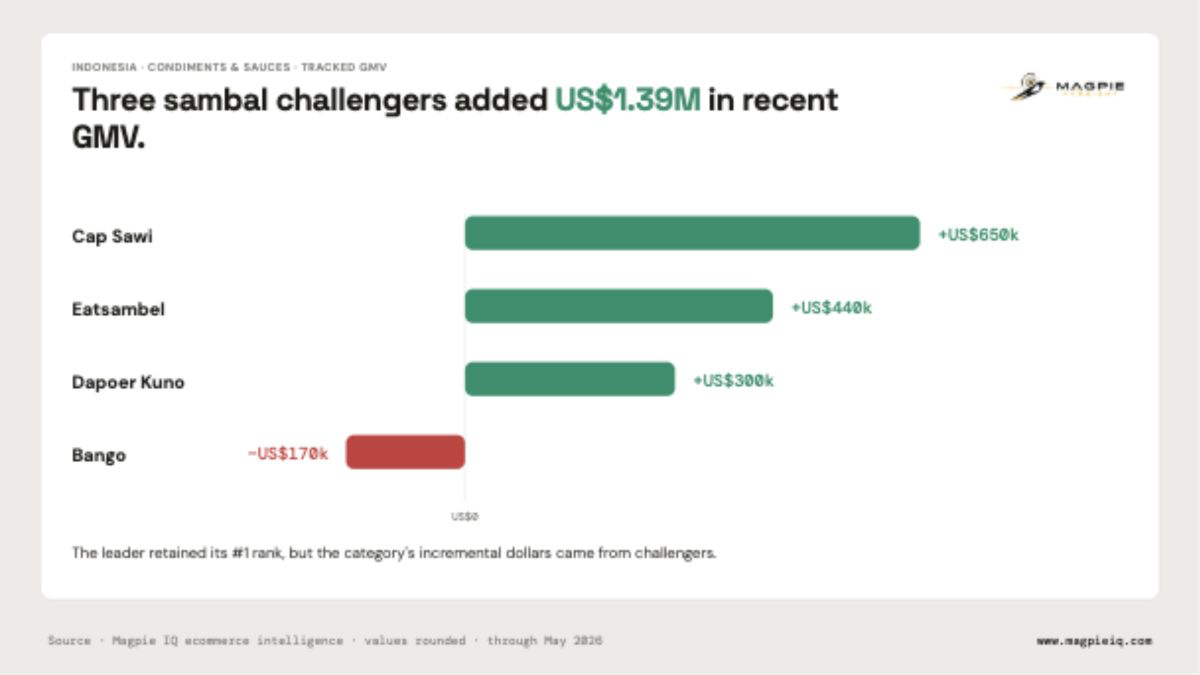
The market reached US$5.1 million in May 2026. Magpie data shows Eatsambel, Cap Sawi and Dapoer Kuno gaining beneath Bango's lead.
Read the market analysis →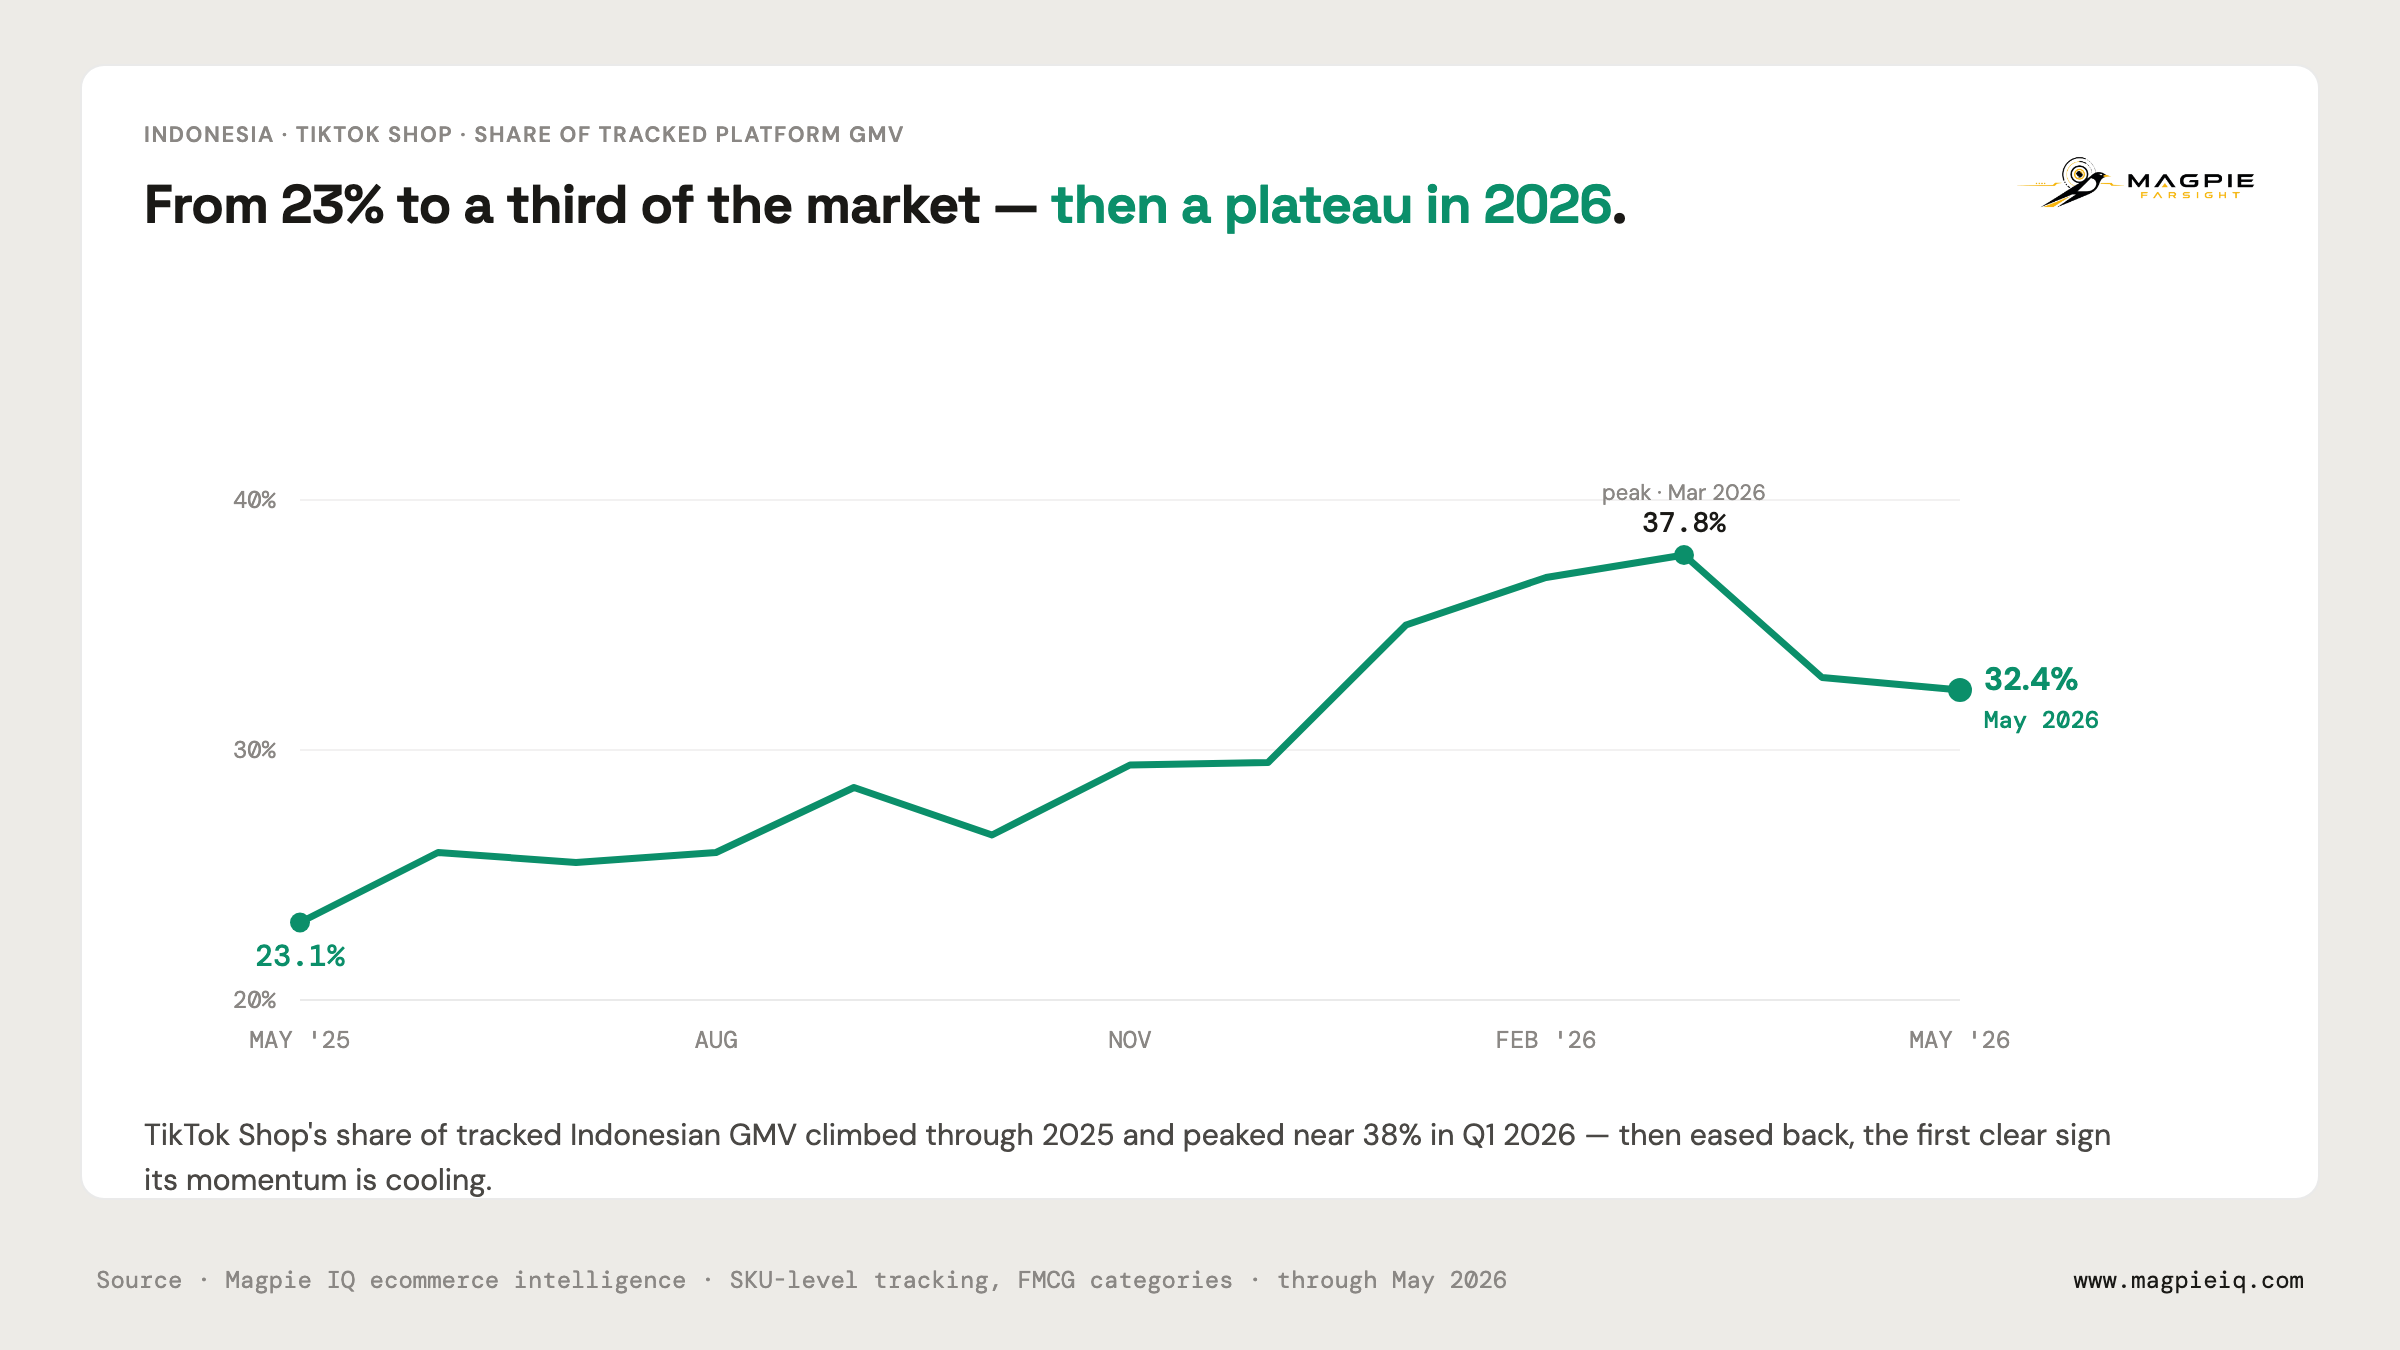
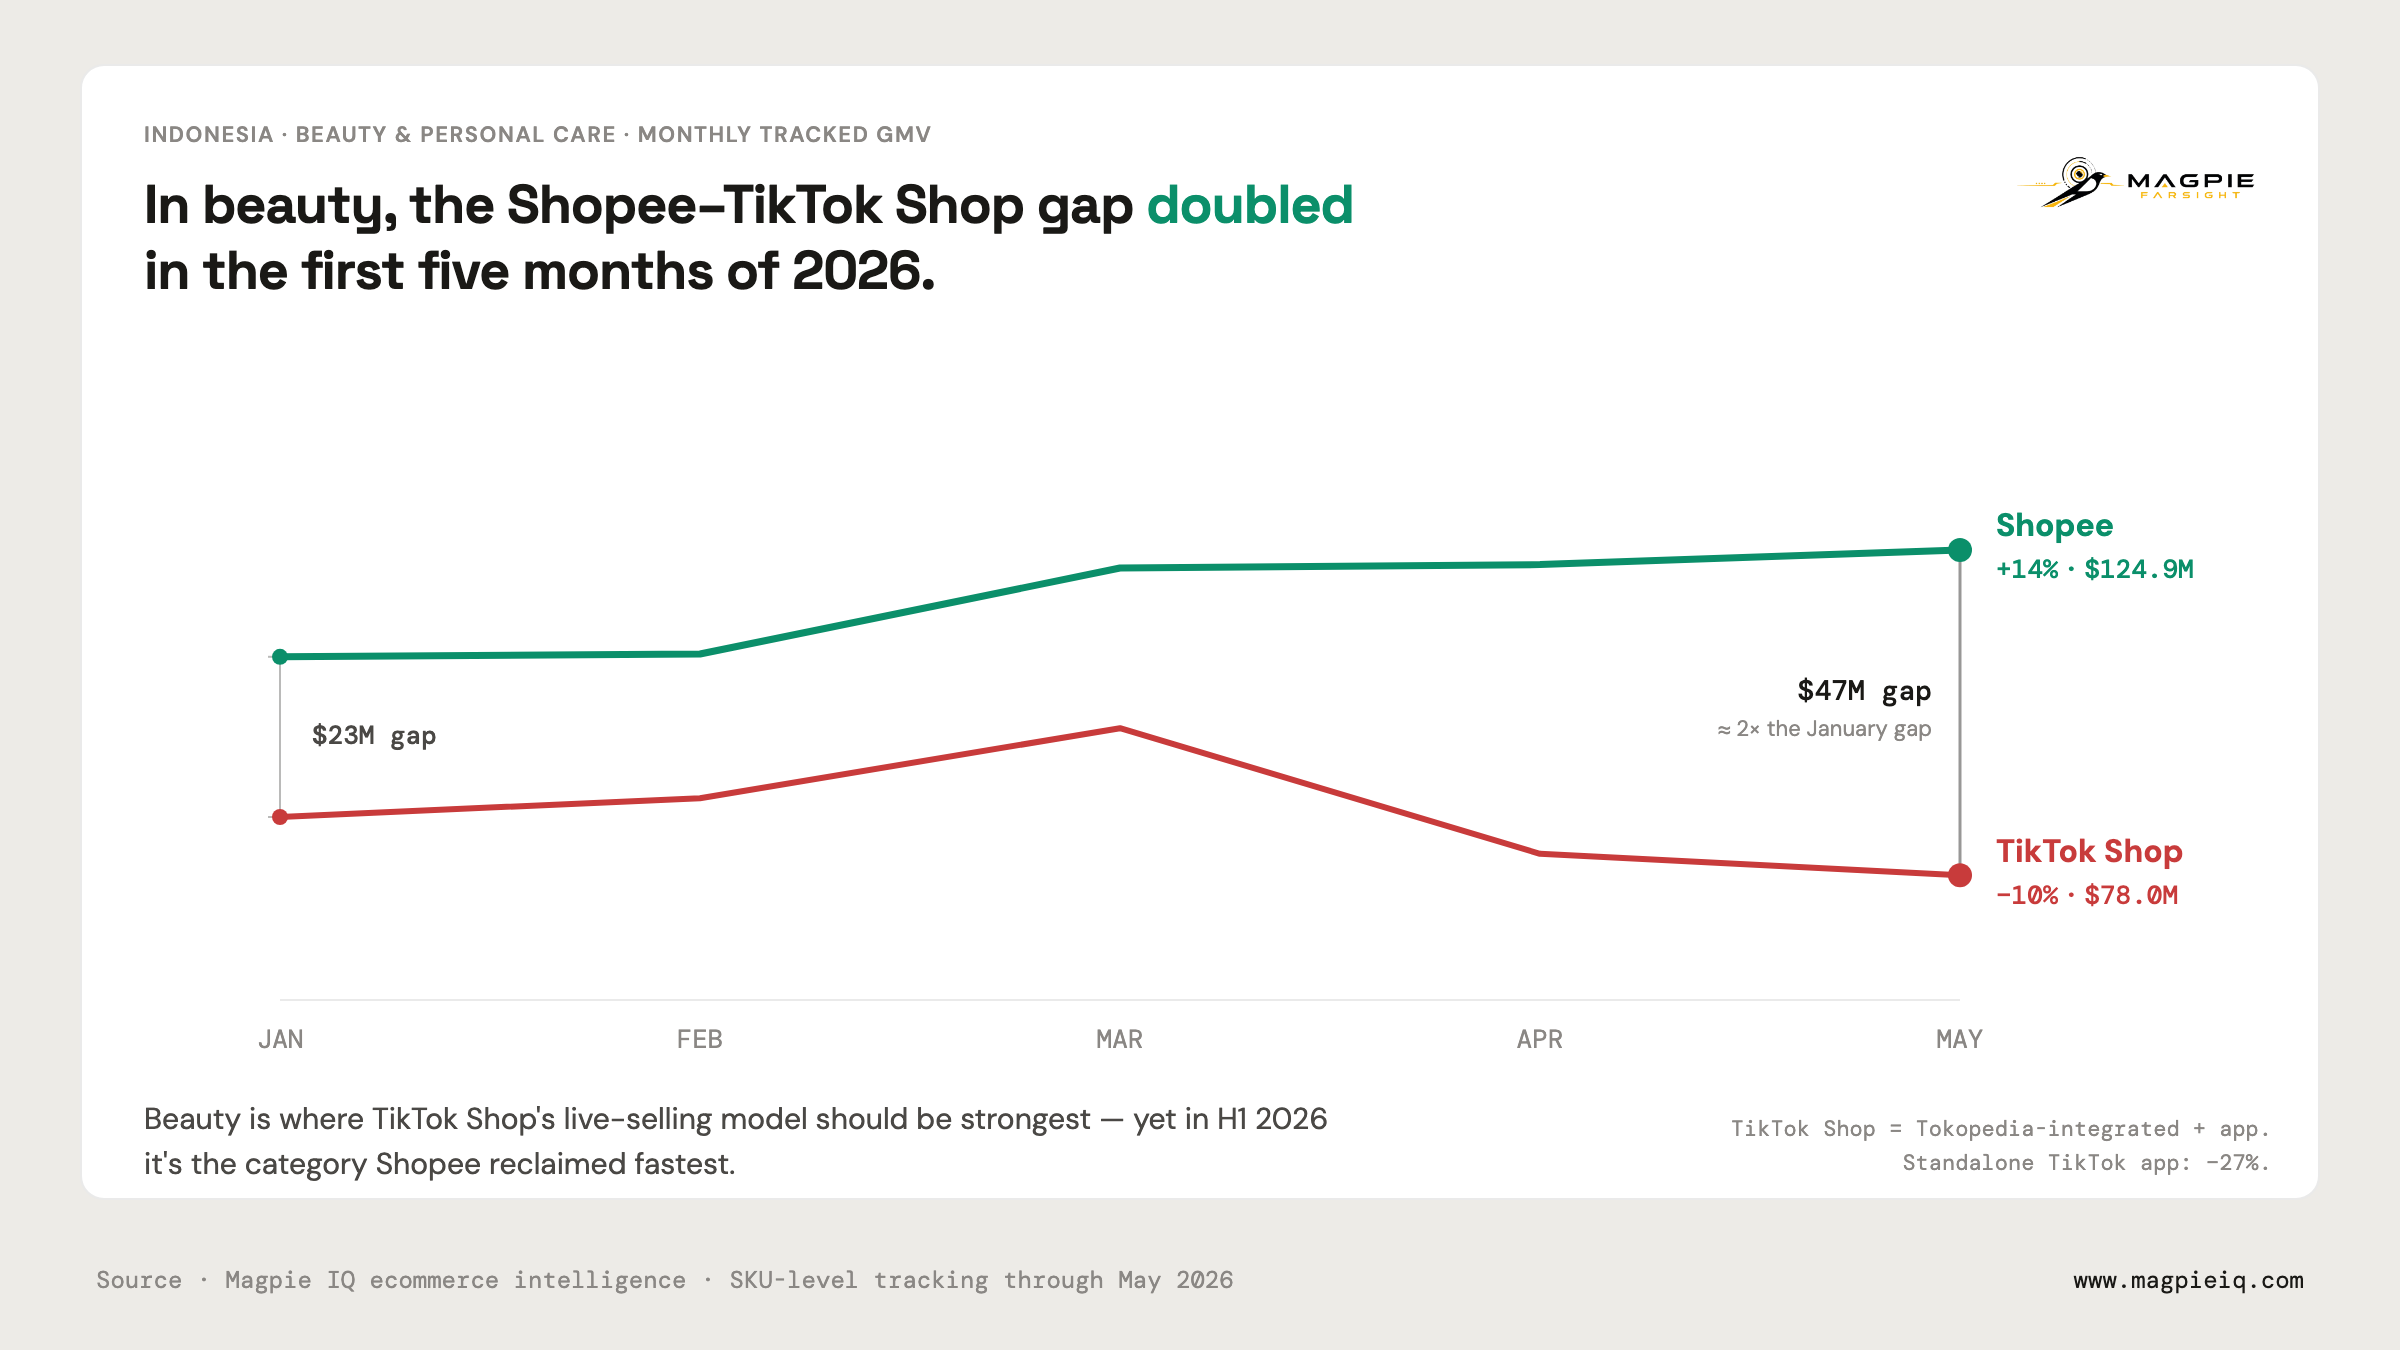
Trusted across Southeast Asia








“Magpie gives us the most granular view of what's actually happening on Shopee—pricing, share movement and competitor stock. It's the data layer our commercial strategy runs on.”
“Before Magpie, tracking competitor pricing across Shopee and Lazada was entirely manual. Now we have continuous visibility—weekly, by SKU—and it has changed how we set price strategy in Indonesia.”
Data you can question and defend
Magpie turns continuously observed marketplace activity into a comparable historical market view through a maintained data pipeline and taxonomy.
Observe marketplace activity continuously across supported markets and platforms.
Clean formats, currencies, attributes and marketplace-specific structures.
Connect brands, sellers, products, SKUs and categories into consistent entities.
Apply quality checks and treat marketplace variation transparently.
Maintain history so teams can compare movement rather than isolated snapshots.
Start with a concrete market view
Where our maintained coverage fits, we will prepare a concise sample with market direction, leading brands, platform mix and one competitive movement. After requesting it, you can immediately choose a time to discuss the market with us.